The Parabolic Constant Mystery
Manas Shetty, Prajwal DSouza, Sparsha Kumari, Vinton Adrian Rebello
Our work presented here is profoundly inspired by the captivating mathematical explorations showcased in 3Blue1Brown's videos. Our specific inspiration stems from intriguing problems addressed by the channel, especially those related to the surprising appearances of pi in unexpected contexts, prompting a quest to unearth an elegant geometric connections in other problems. One particular instance that intrigued us was a connection between parabolas and squares.
This curiosity led us on an eight-month-long intellectual journey of exploring various techniques to decipher this puzzle. The discovery of a simple yet elegant connection was nothing short of a revelation that left us awestruck.
Having patiently waited for nearly three years, we believe the time is ripe to unveil our findings. It is our honor to present this work at SOME3, which we deem to be the perfect stage. As participants in SOME3, we are thrilled to share our results and be part of SOME3.
This was made with viewX , a visualization library designed specifically to make mathematical animations found on this website. It is still in developmental stage and little buggy. :)
Also, we cannot forget role of interesting ideas from Matt's video - 'There is only One True Parabola' (Standup Math) that 'all parabolas are similar' which helped us understand the concept of similarities and the nature of constants like pi.
Consider a unit square and pick a point Q at random along the square's boundary. What do you think is the average distance between this chosen point Q and the very heart of our square, the center C?
The average distance is the typical or middle value obtained when you add up all the distances between any two points then divide by the number of distances you added together. It's a way of finding a 'common' or 'usual' distance in a group of different distances.
Surprisingly, the answer is approximately 0.5738967... a peculiar figure, isn't it? This number equals P/4 where P is known as Universal Parabolic Constant. The value is around 2.295587149... Hold on a second - a "Parabolic" Constant? But our question was about squares, wasn't it? Where does the parabola come in?
This might seem like a co-incidence. But, we look for a circle when π pops up in various places right? Just check 3B1B :P So, why not dig a little deeper. And if we explore a little more, there are other seemingly unrelated math problems where you see this number show up.
So, What do you think is the average distance between any two points inside a unit square? Take a guess. :D
Move the slider to choose your answer... and also, the points A and B above are draggable. :)
Here is a slightly similar problem.
What do you think is the average distance between the center and any point 'inside' the unit square?
Take a guess. :D
Point B above is draggable. :)
It is about 0.38259785 ... To be exact, it is.
Yep. There's a P here too.
Why do these constants appear?
Can we cook up more? Are they present only in parabolas and circles? I mean.. take a square of side length \(L\) if you take a ratio of perimeter \(4L\) divided by diagonal \(\sqrt{2}L\) is always \(\frac{4}{\sqrt{2}}\).
Turns out any shape that scales symmetrically, has these constants. To be more specific, similar shapes will posses such constant... and yeah, all circles are similar. But here's a surprise, all parabolas are similar too. Please check Matt's video (Standup Math) for more details.
Because, when we scale a shape by a certain amount, let's say.. doubling the size of a circle, the radius and circumference both double. So, the ratio of circumference to radius remains the same. The same goes with any shape, the ratio of perimeter to diagonal for a square.
For those among you, who want a serious proof that the slope is indeed equal to 1 at point H. Here's some calculus.
The equation of the parabola, with latus rectum 2a is given by
The points C and H here are at (0,0) and (2a, a) respectively.
Because when
1. \(y = 0 \) when \(x = 0 \) (the vertex C)
2. \(y = a \) when \(x = 2a \) (our point H)
Now, differentiate the equation of the parabola to get the slope at any point (x,y) on the parabola.
$$\frac{dy}{dx} = \frac{x}{2a}$$
So, at H, where x = 2a, \(dy/dx = 2a/2a\) = 1, so the slope is 1, and hence,
At H, the tangent makes a 45 degree angle with the x axis.
Wait. Back up, before that..
How do we know that it is a Parabola for sure?
If we look at the final curve, it must obey the equation of a parabola, which is
$$ y = \frac{x^2}{4a} $$
the point that obeys this equation is of the form,
$$ \left(x, \frac{x^2}{4a}\right) $$
The goal is to show that if I pick any point on that curve, when we sample large number of points (that is \( n \to \infty \) ). It must obey that equation.
Let's start simple, if we had just picked 3 points, n = 3. Then, each line segment (CQ1, CQ2 and CQ3) added to the curve would contribute a point when scaled down.
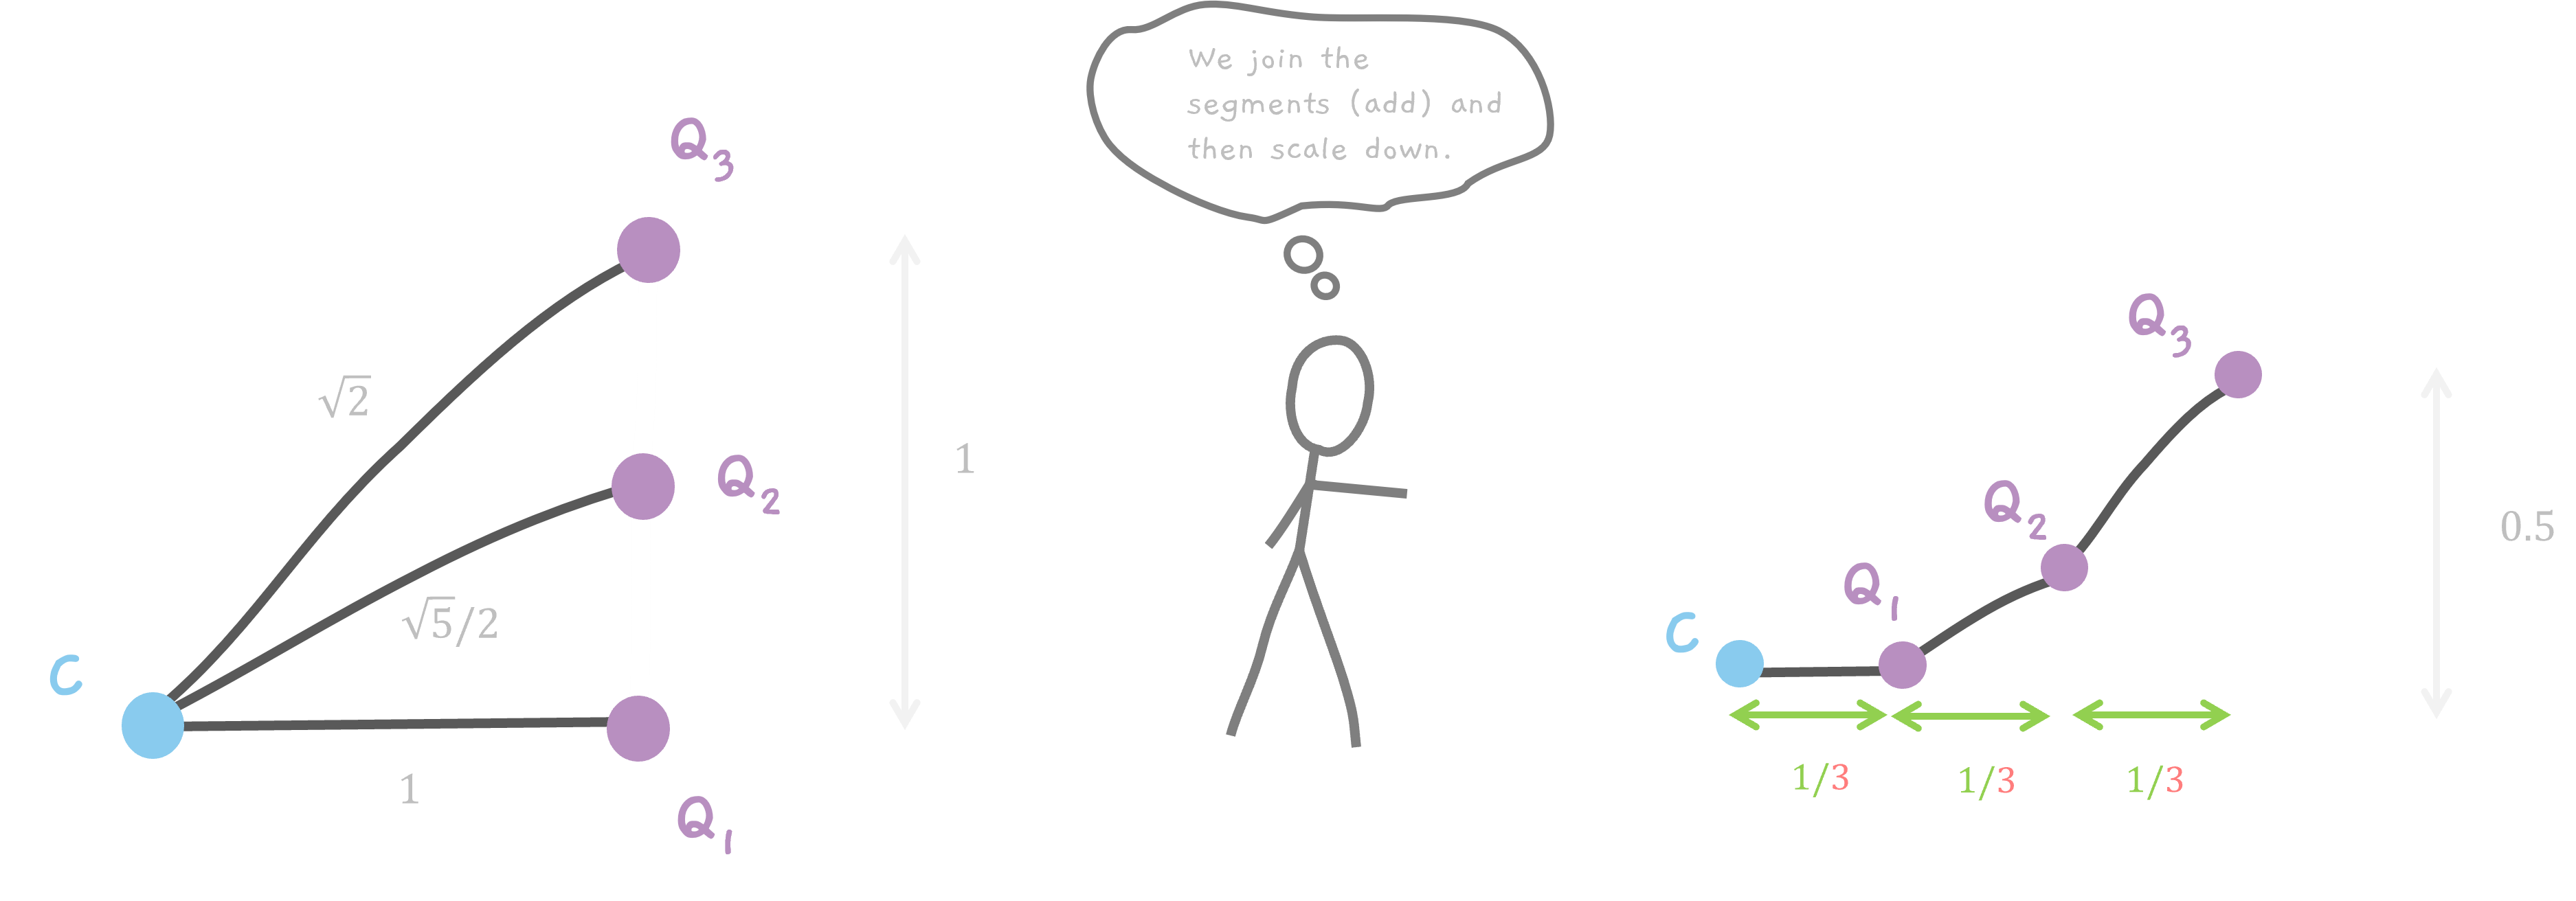
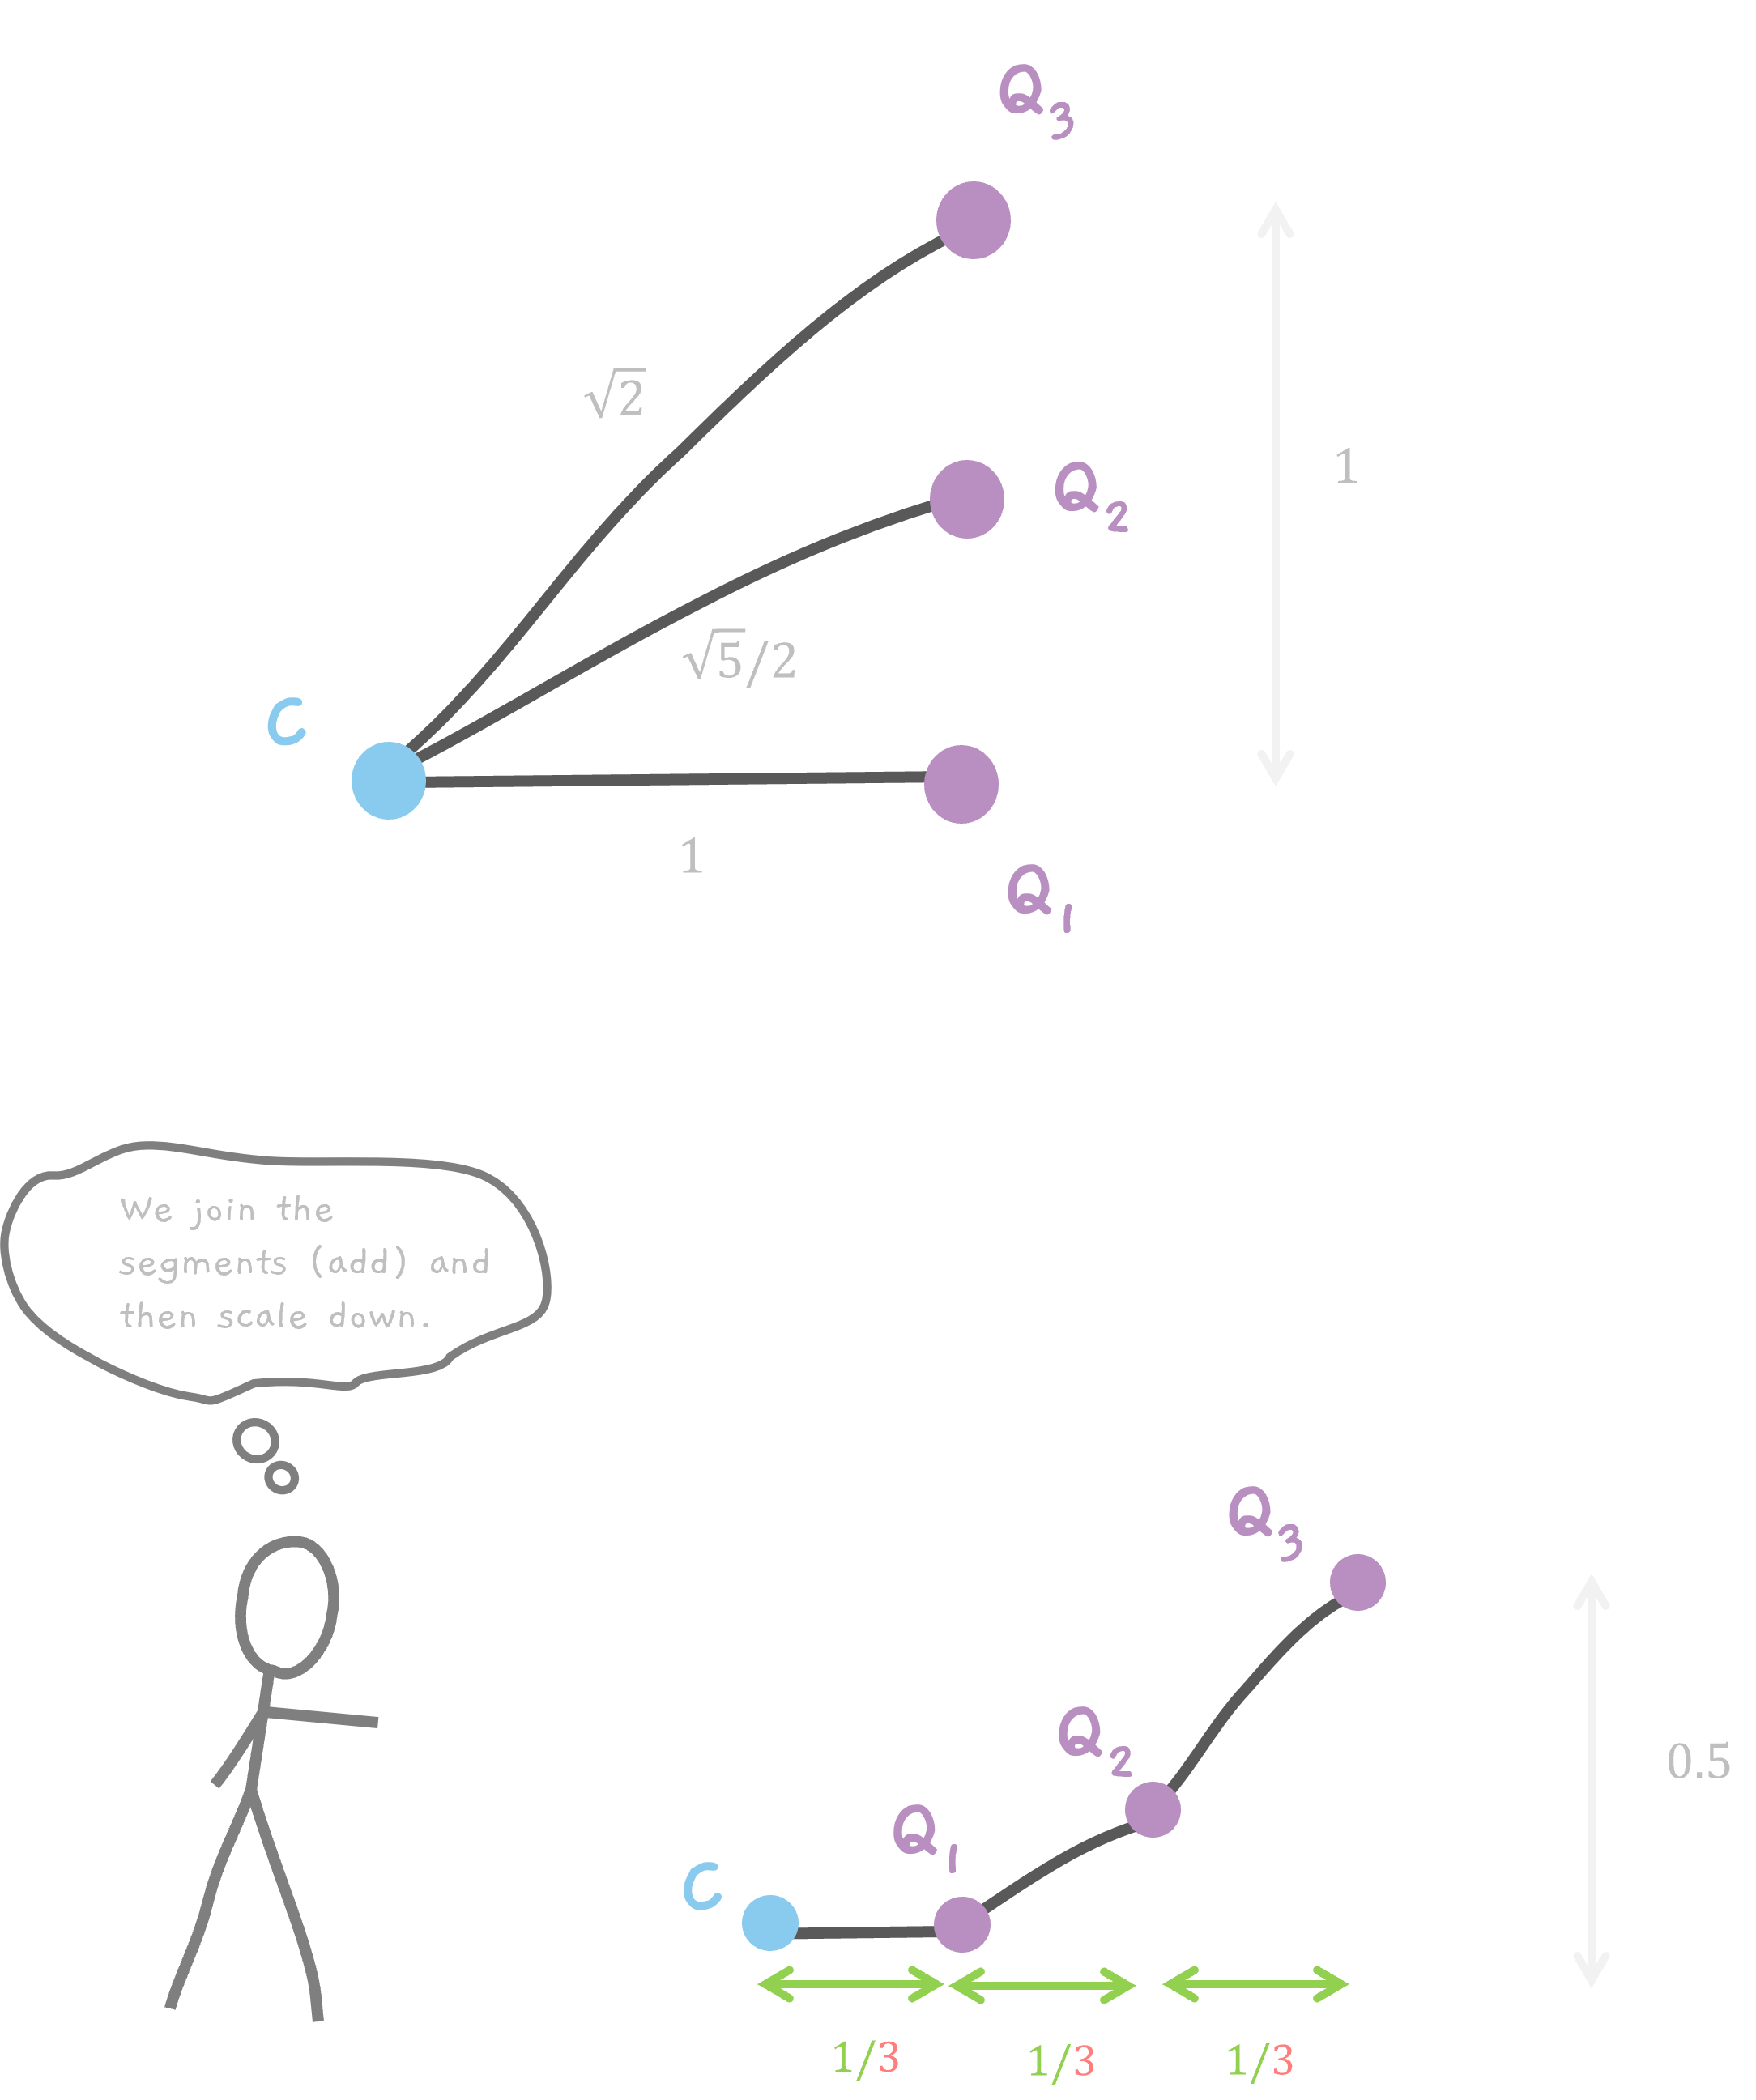
What we want is the final coordinates of the point Q1, Q2 and Q3. This is easy to do. And yes, C is the origin.
There are two steps here. Add and Scale down.
So.. any point Q will hold different coordinates in each of these changes.

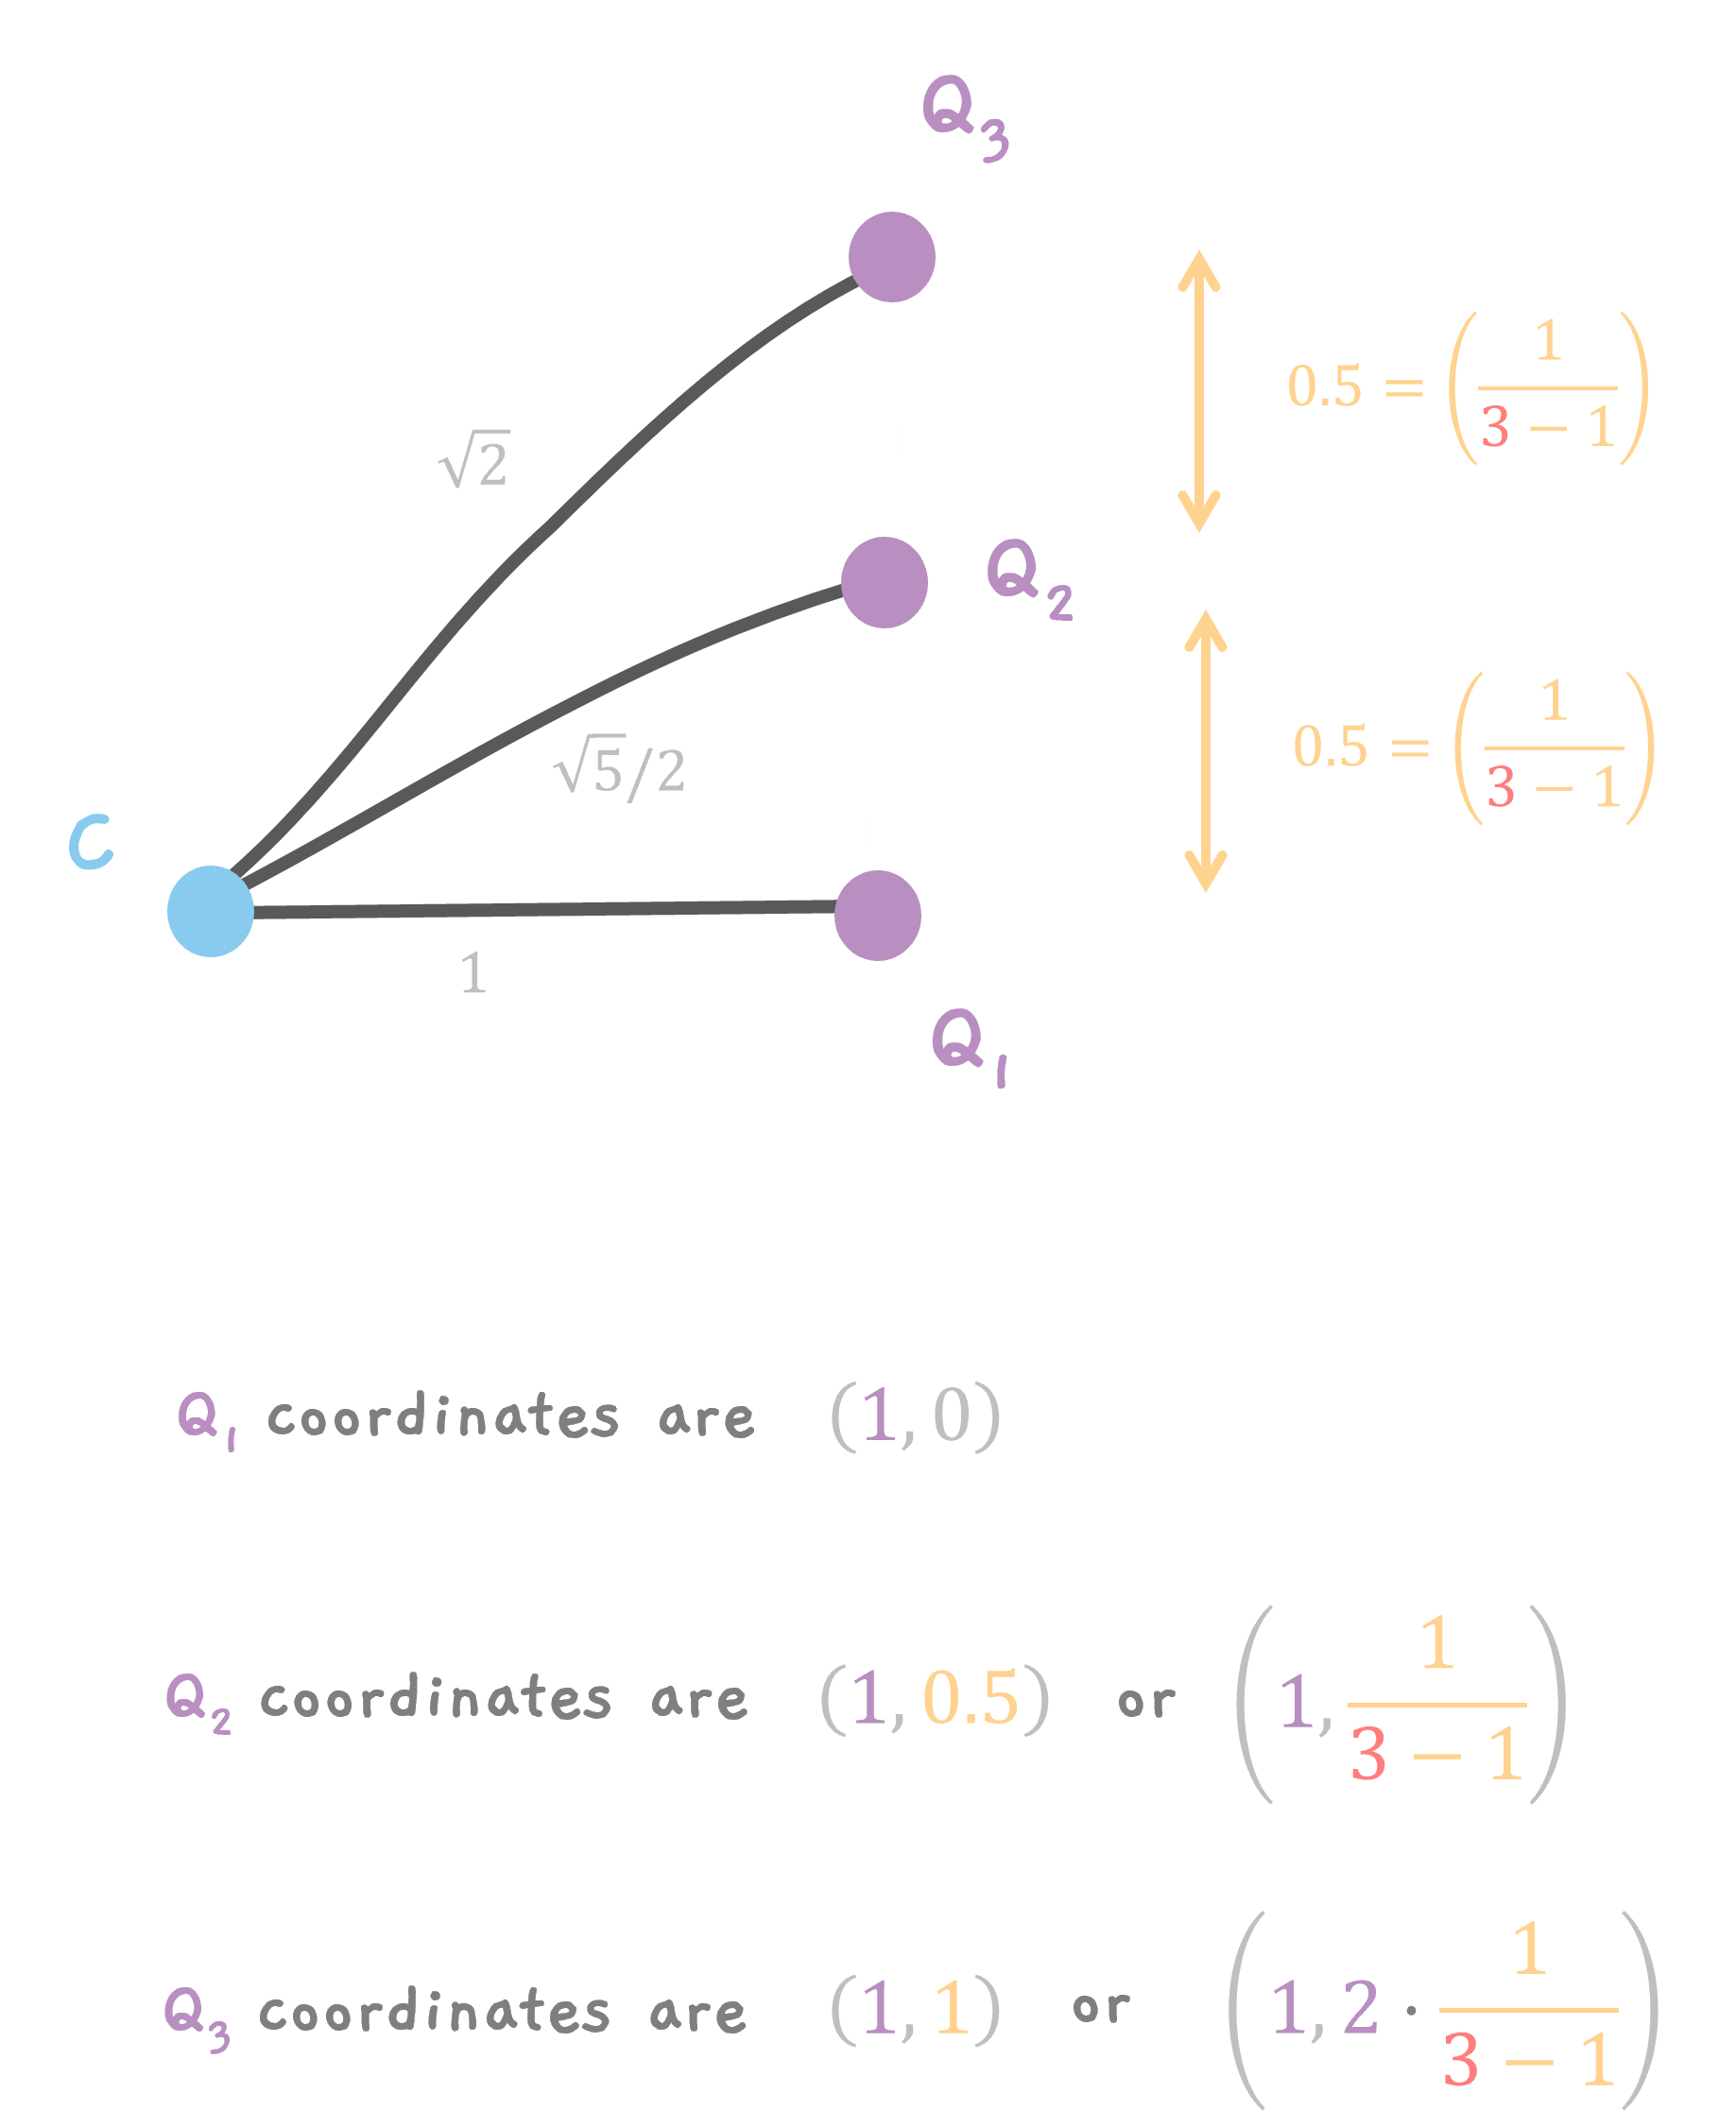
Before Adding the segments.
All the points are on the line AB. So, the x coordinate of all the points is 1. The y coordinate, is a fraction of the length of the line AB. Remember, for n points, we divide the line into n - 1 segments. So, the length of each segment is 1/(n - 1). So, for 3 points, the distance between each point is 1/(3 - 1) which is 1/2.
So,Q1 has coordinates of (1, 0), Q2 has coordinates of (1, 0.5) and finally Q3 has (1, 1).
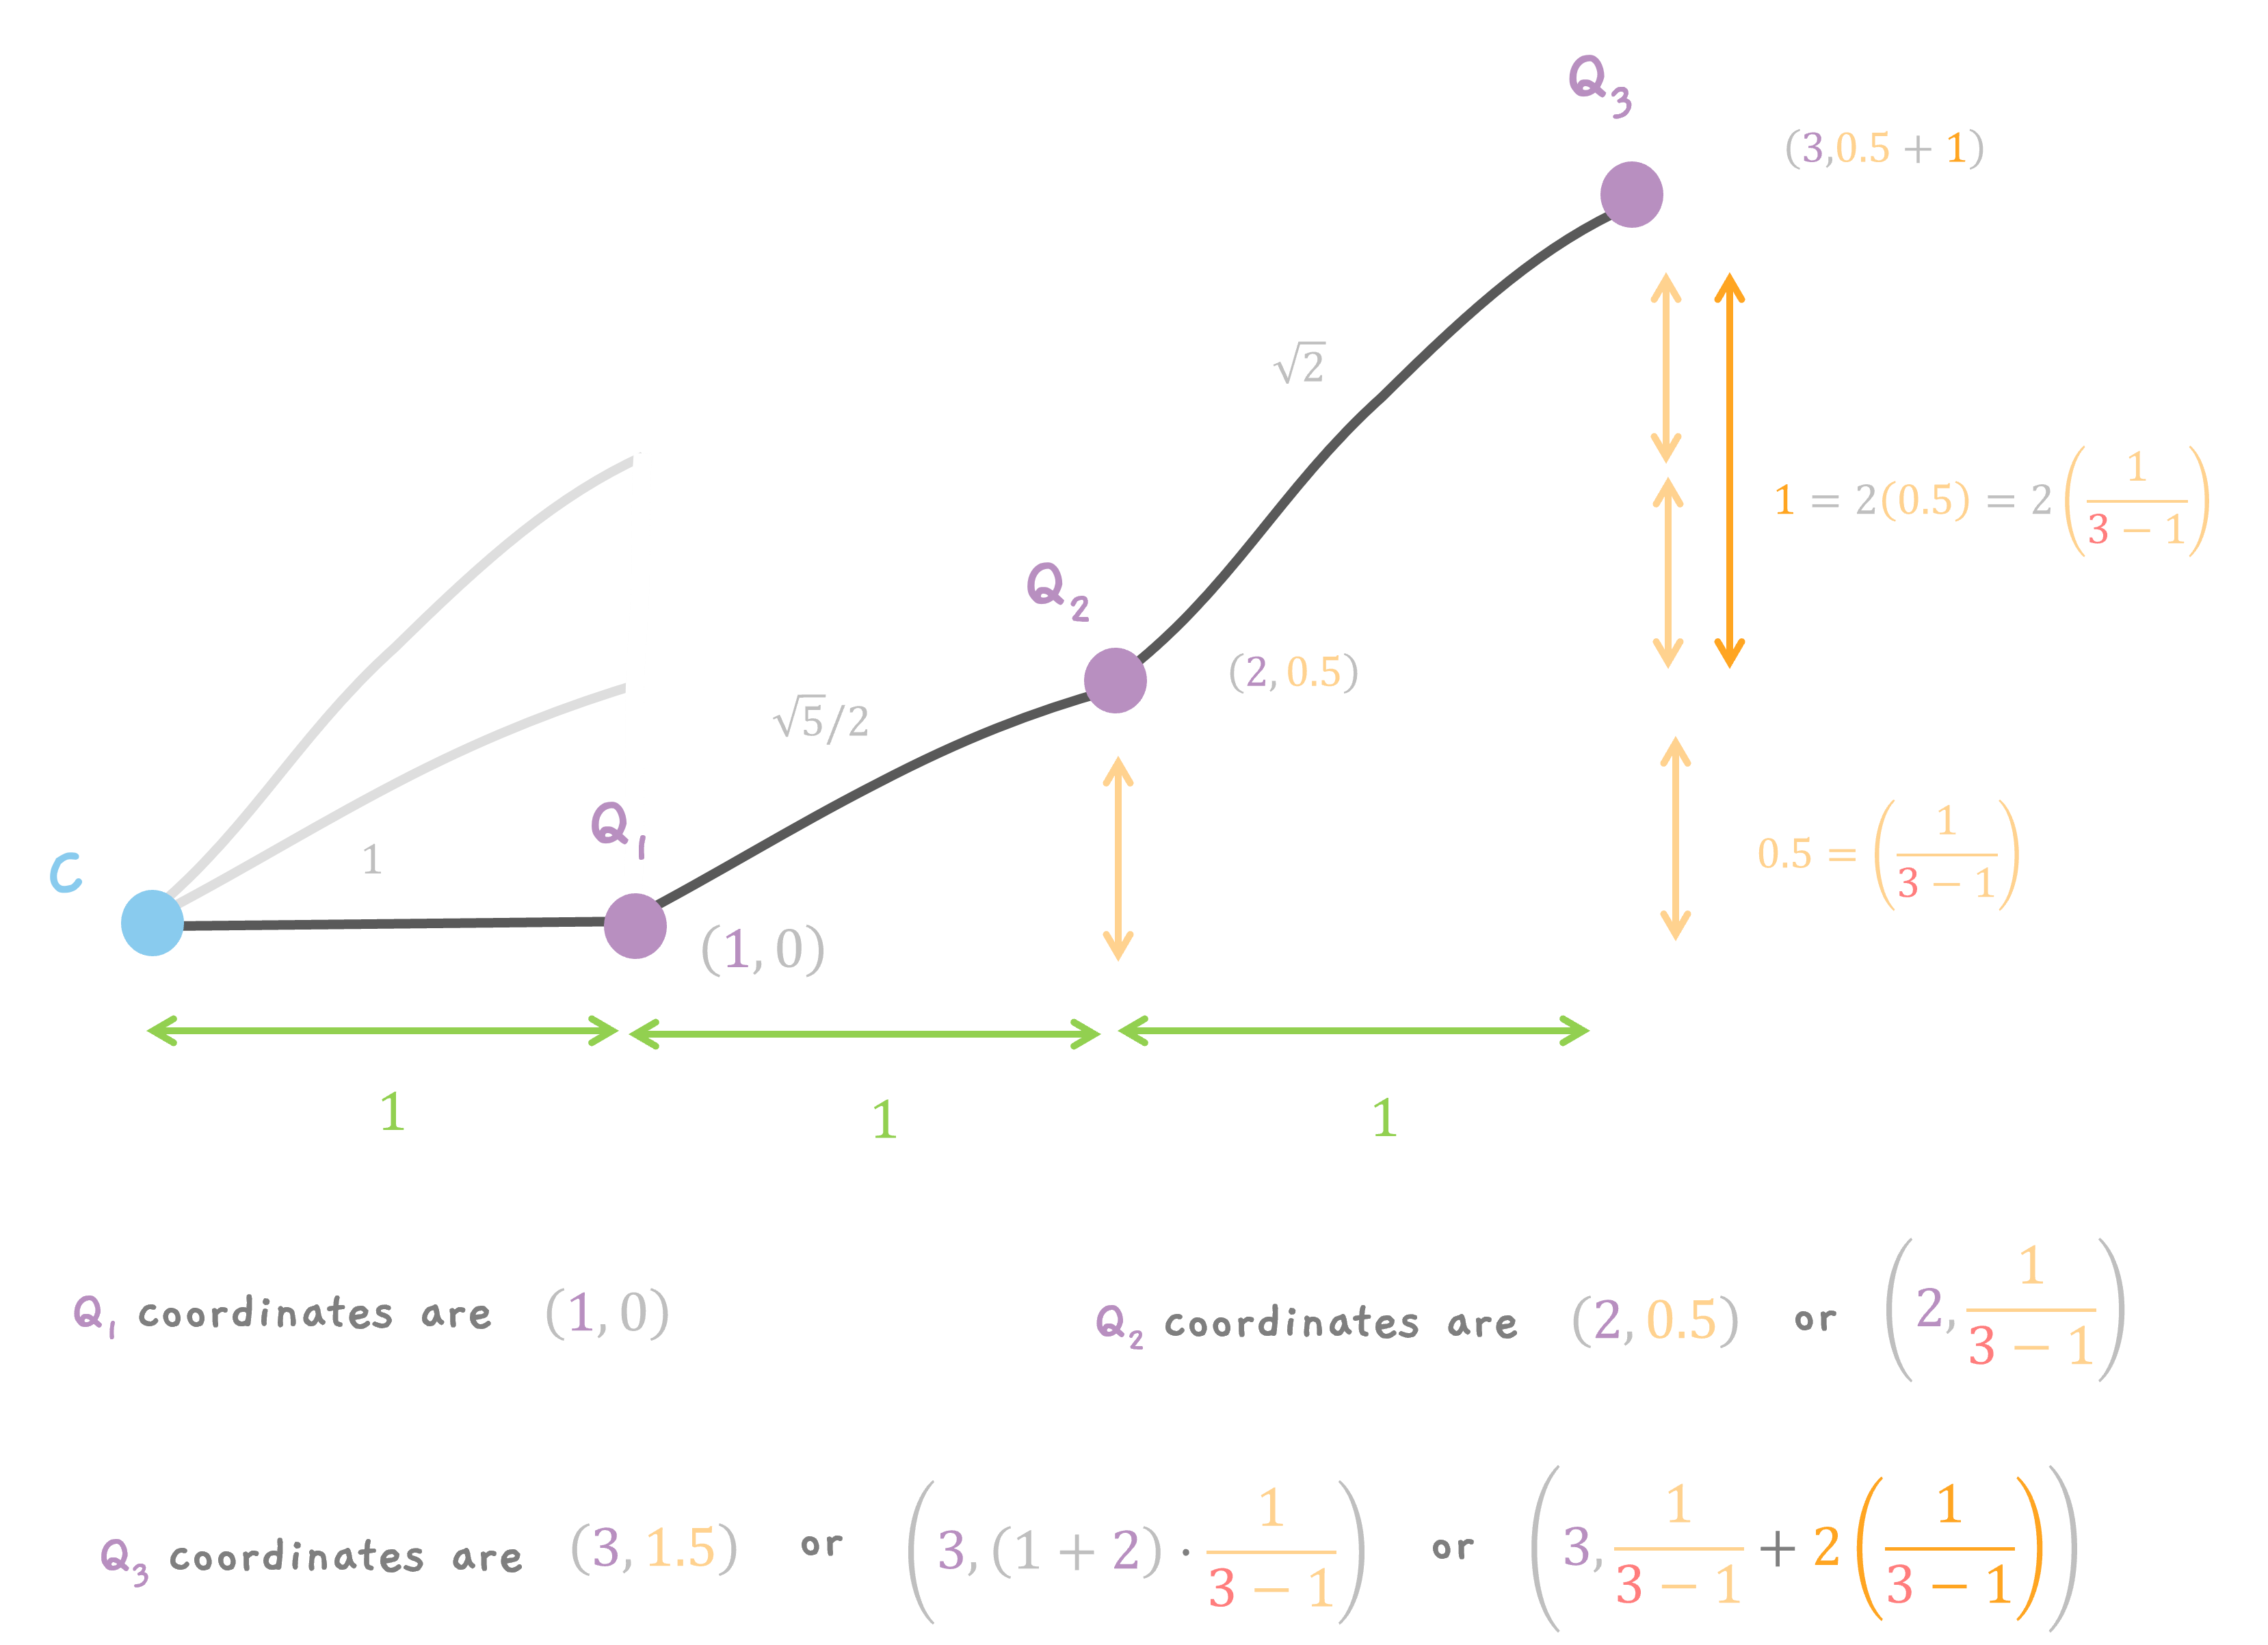
On Adding the segments.
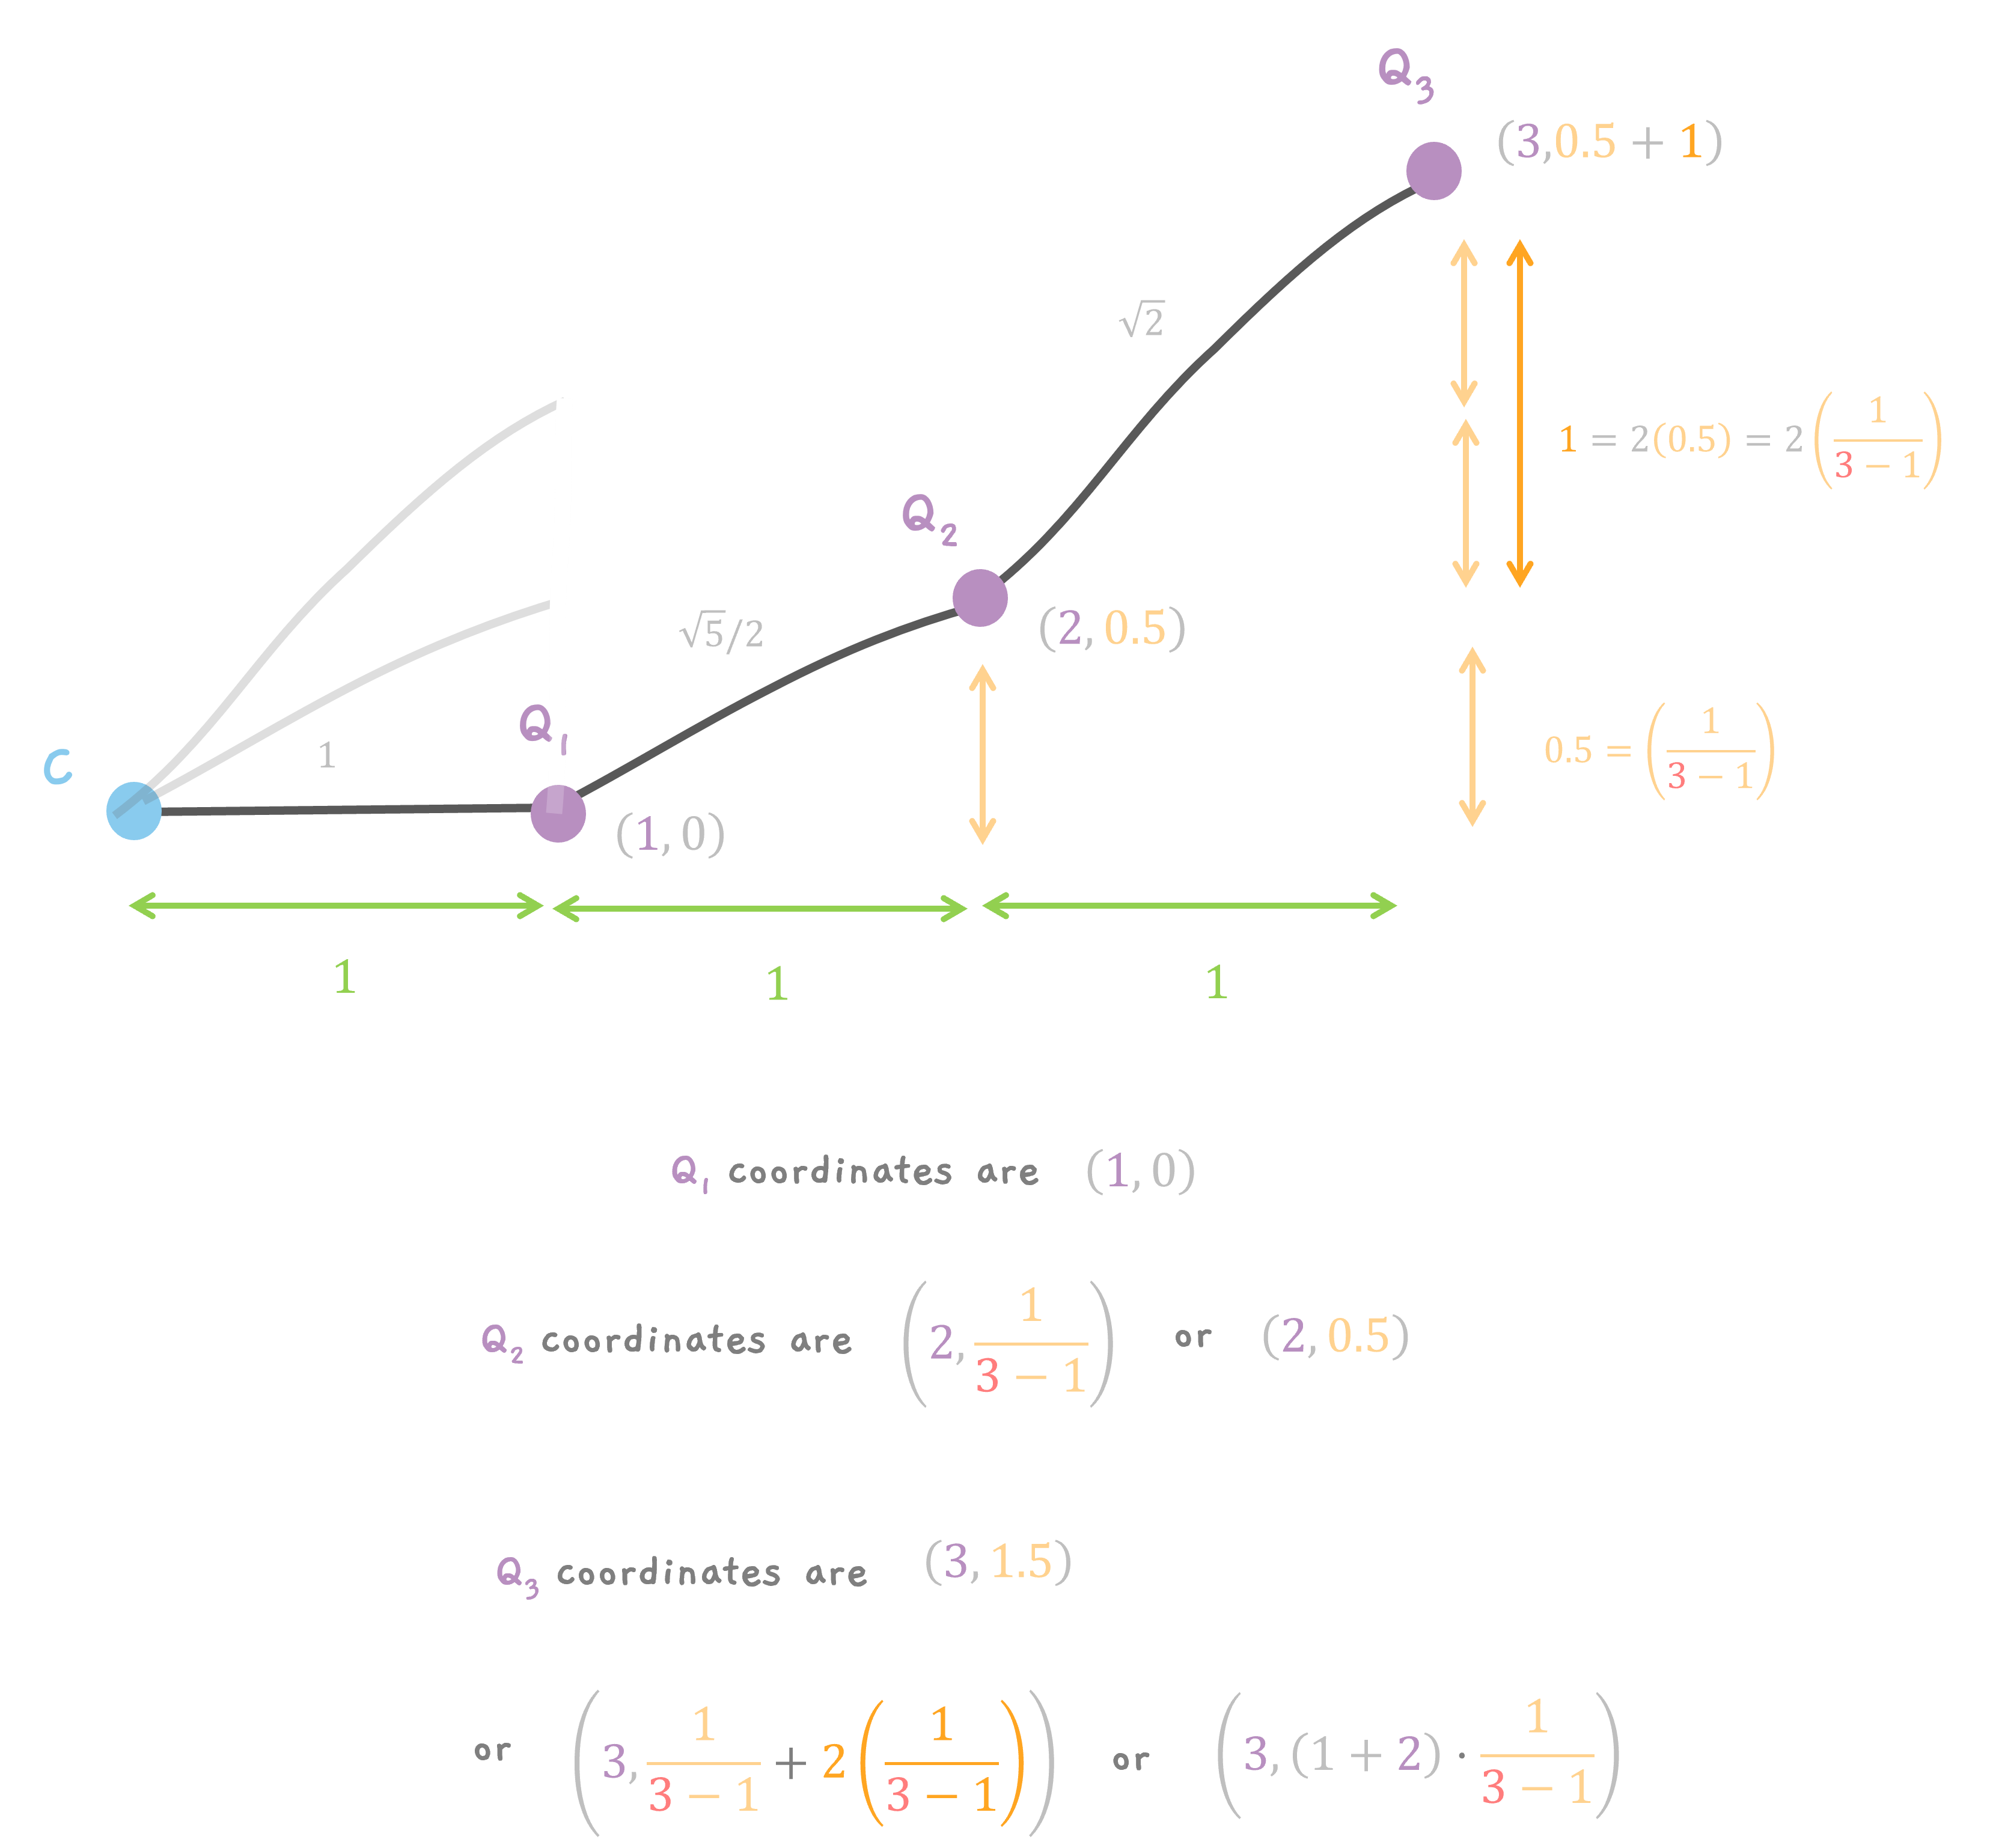
When the segments are added and moved, the x and y coordinates change. For x coordinates, it is easy. Every point, moves to a multiple of 1. So, Q1 stays at x = 1. Q2 moves to x = 2 and Q3 moves to x = 3.
For y coordinates, it is a little more complicated.
Q1 remains where it is at y = 0. But Q2 gets a one multiple of half So, it moves to y = 0.5. And Q3 gets a two multiple of half which is 1 from earlier (remember Q3 was at a height of 1). But, also the additional 0.5 from the previous Q2 because of addition, giving y = 0.5 + 1 = 1.5.
After Scaling down.
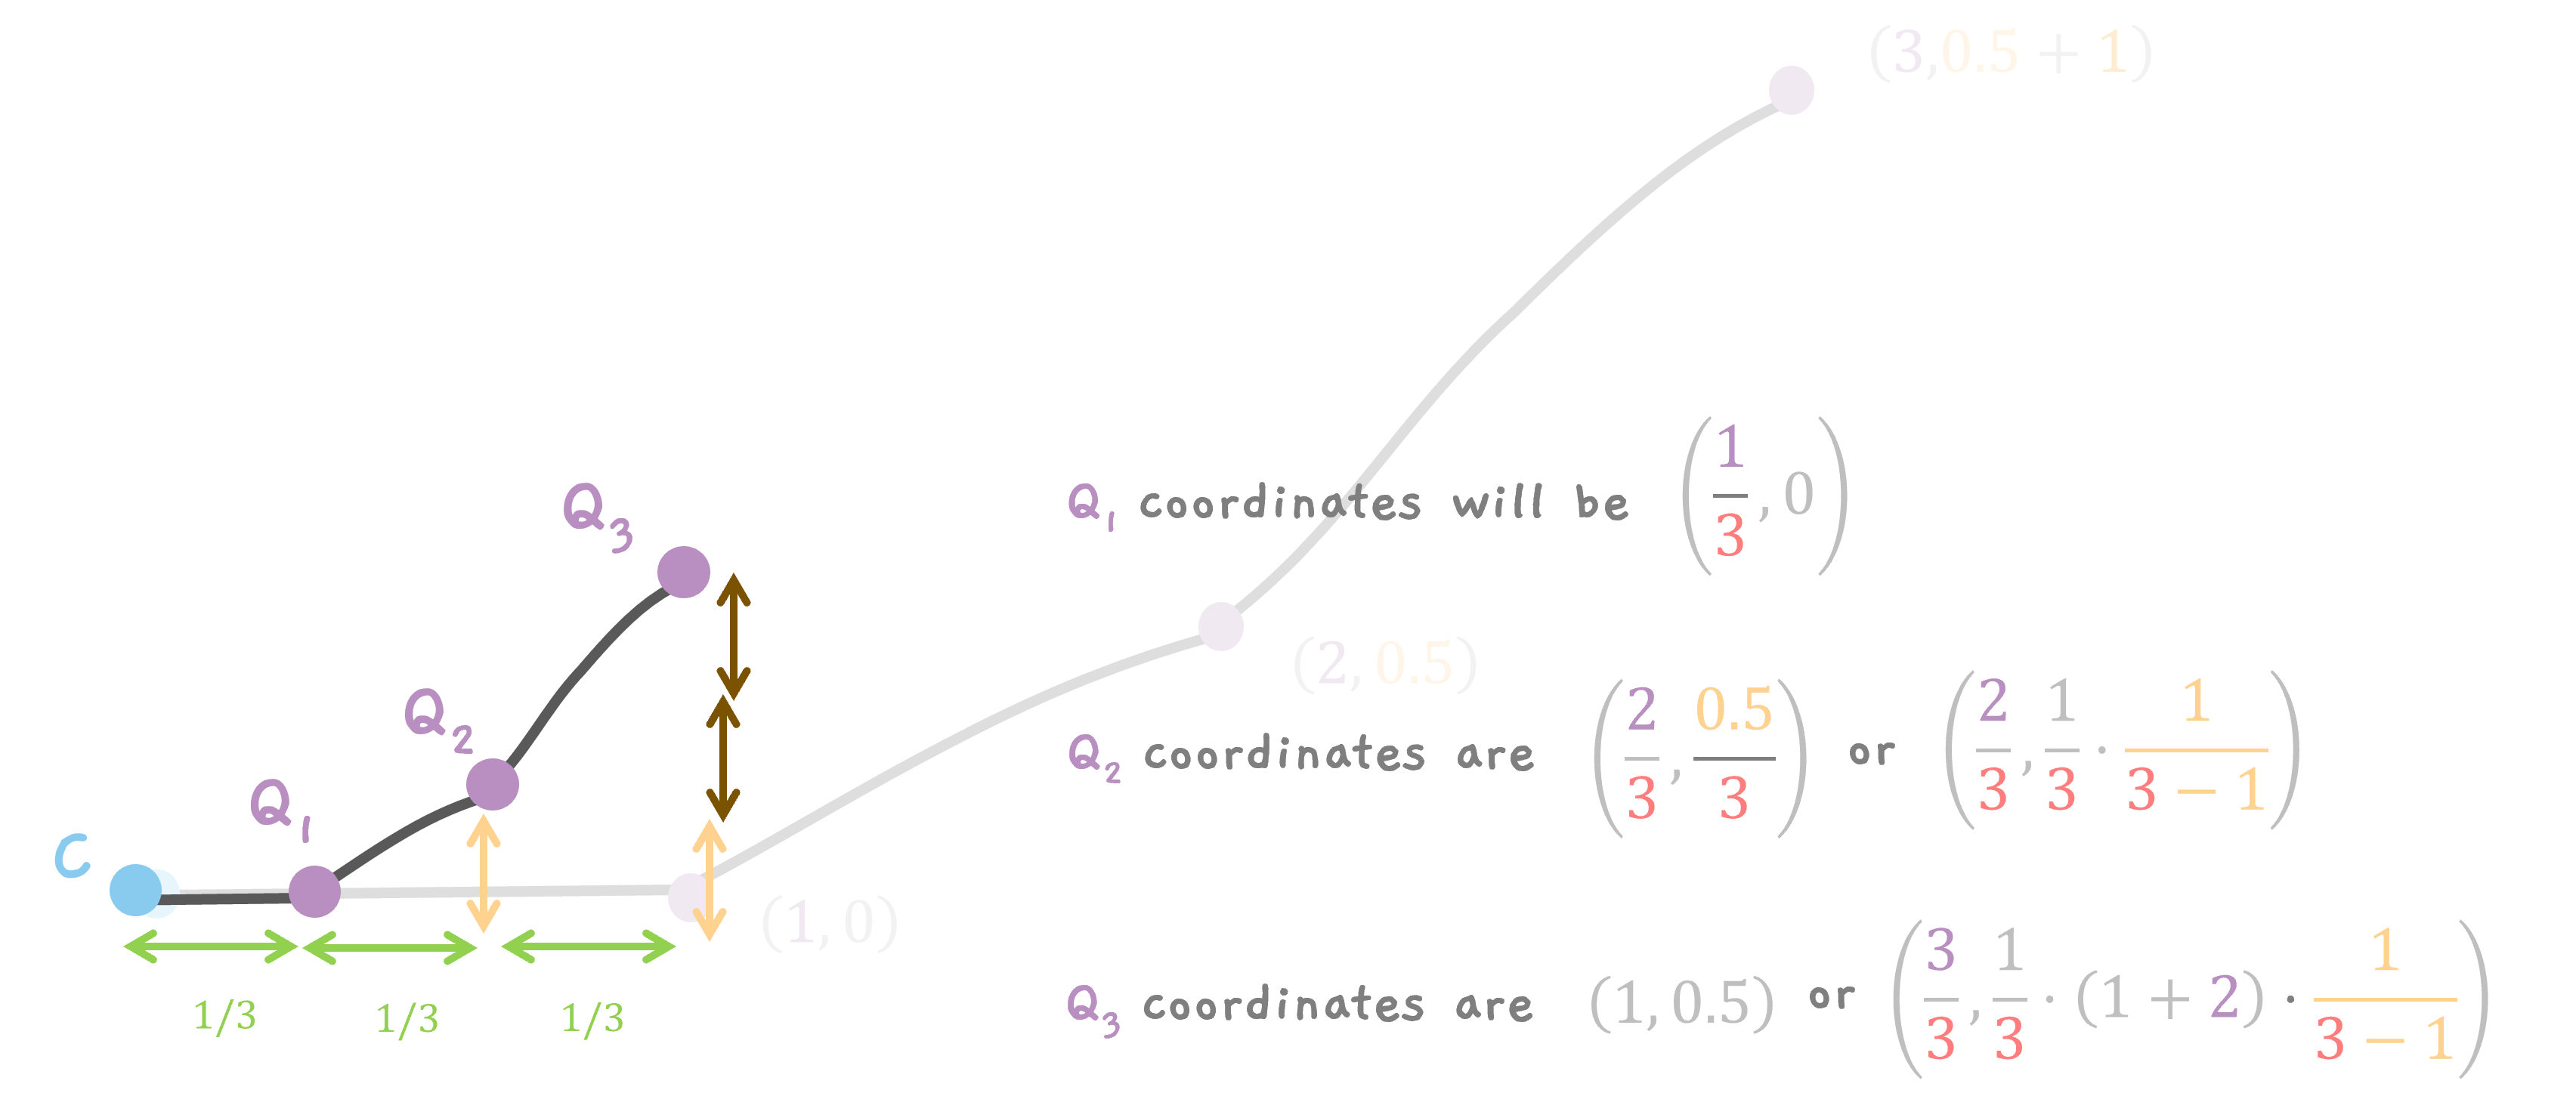
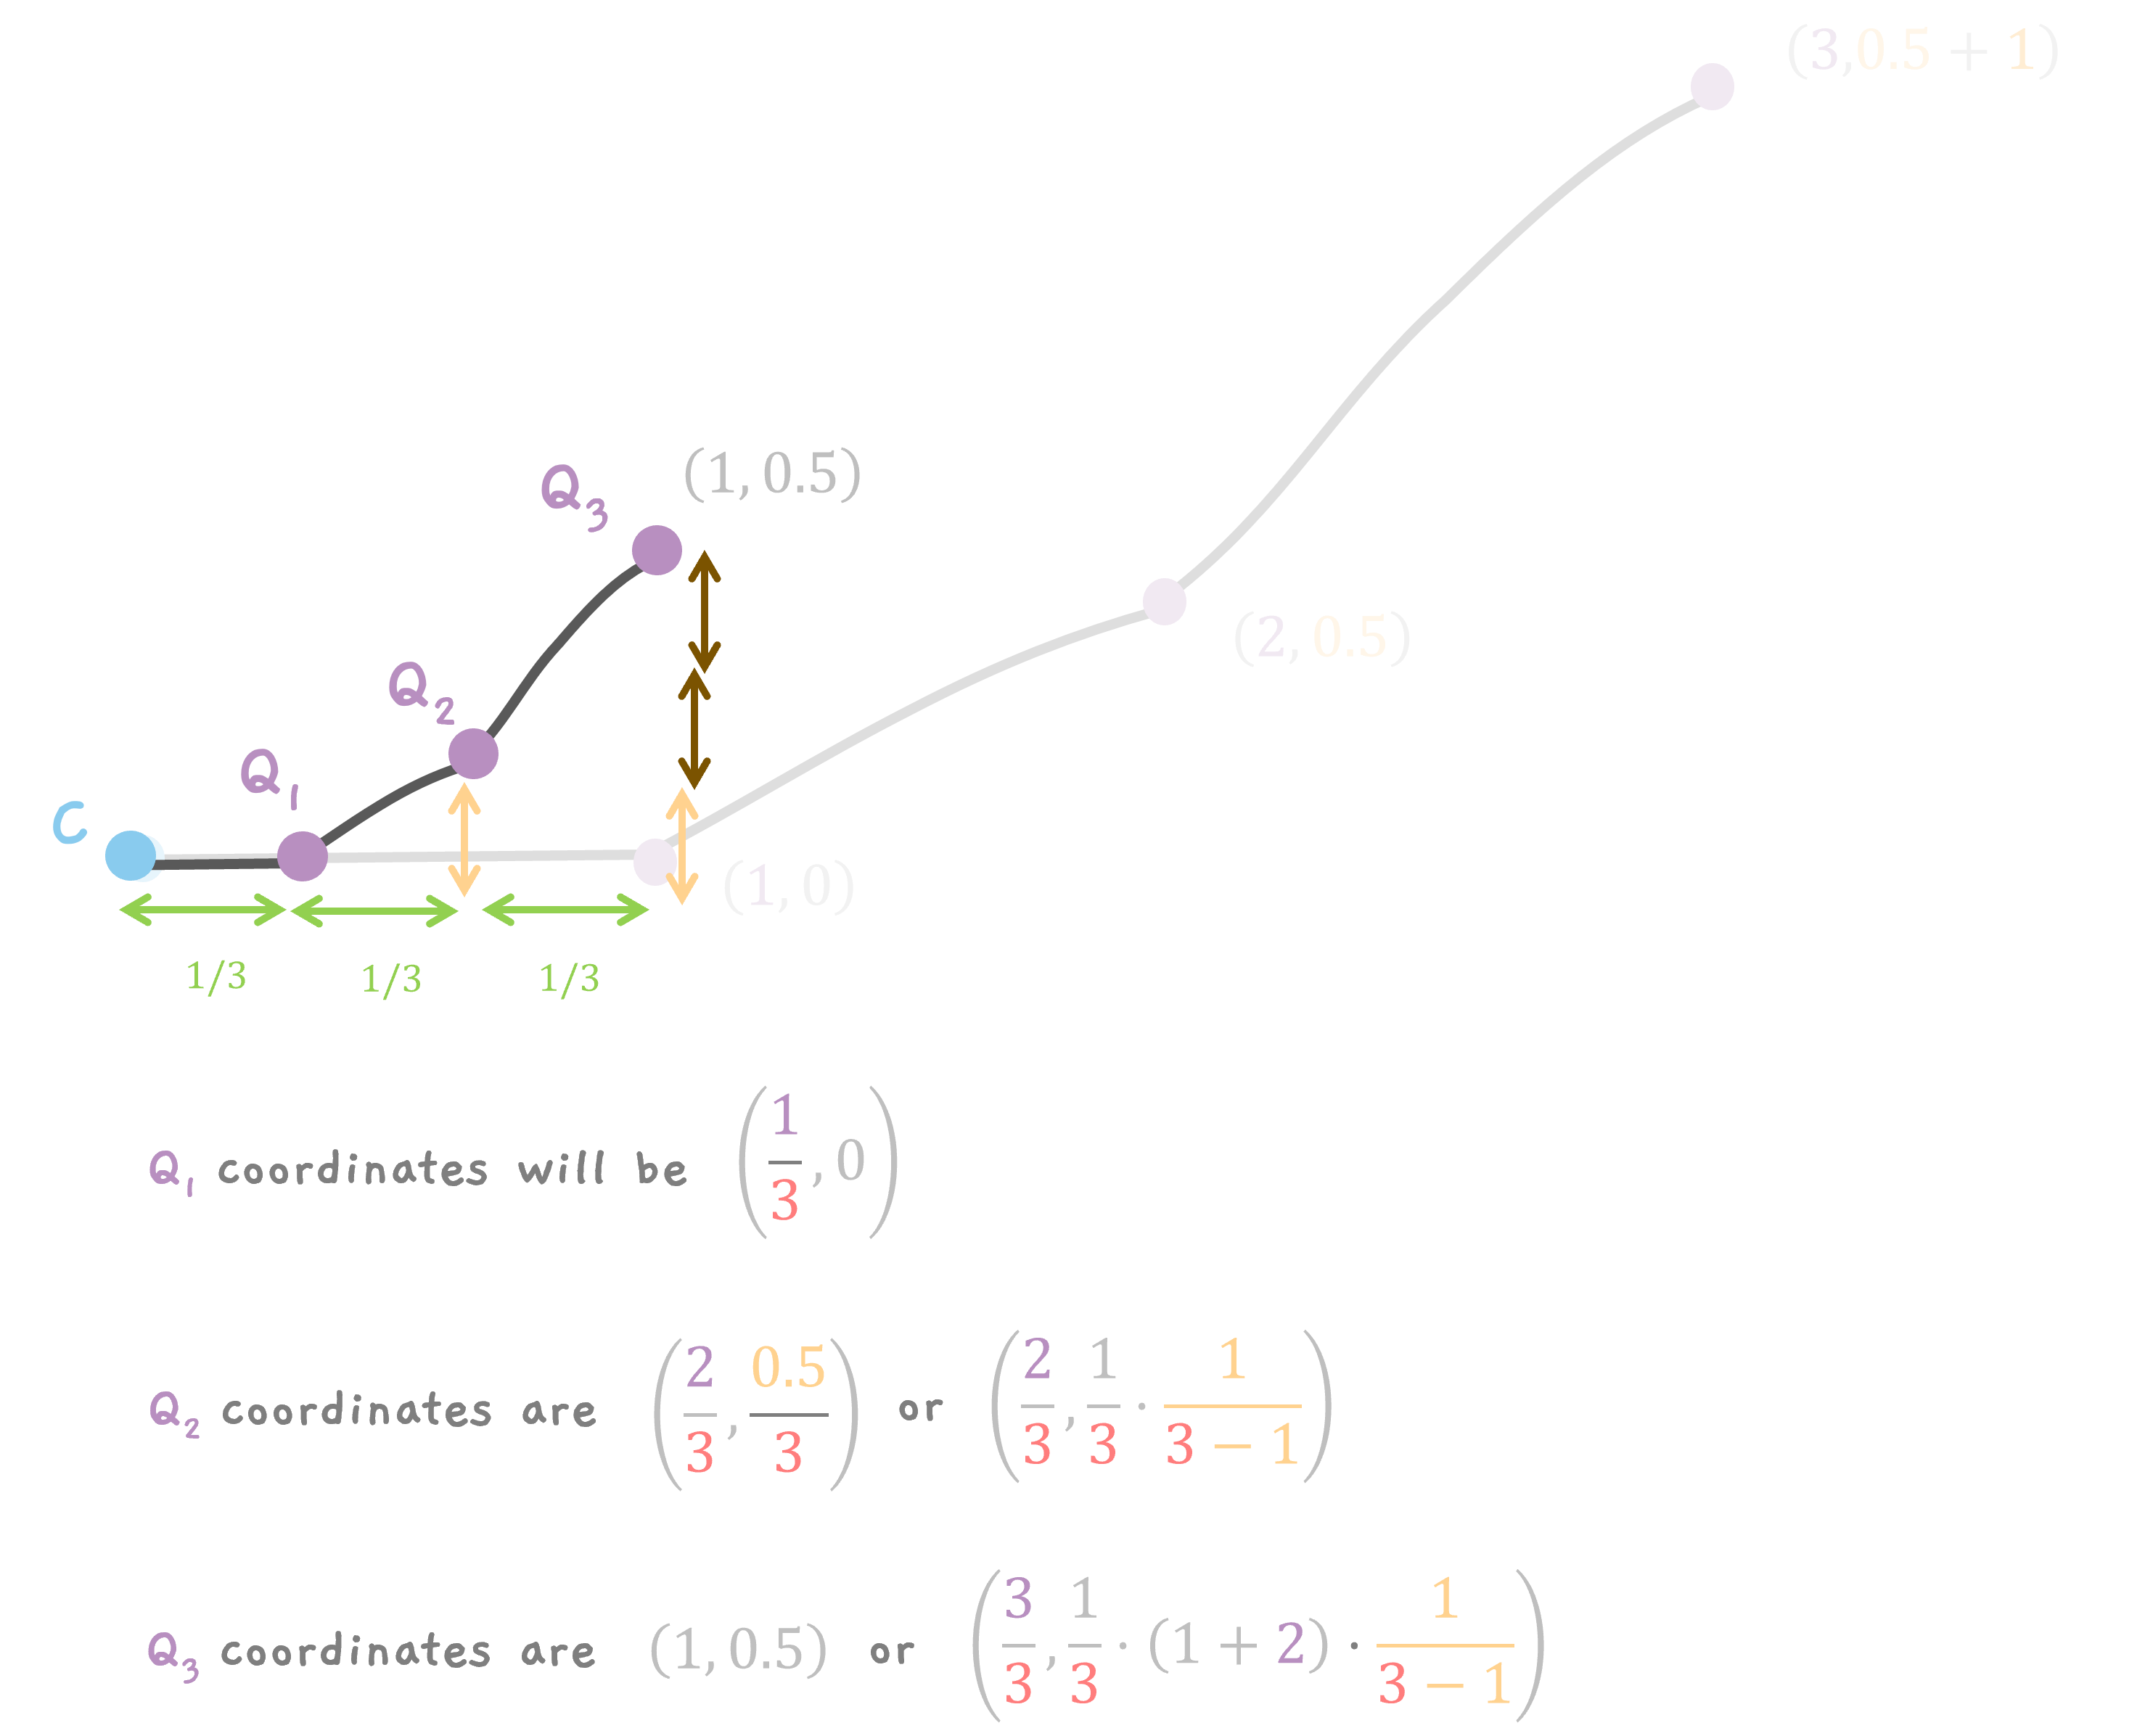
Now, we scale down the curve by a factor of 3. So, the x coordinates of all the points are divided by 3. So, Q1 goes to x = 1/3. Q2 moves to x = 2/3 and Q3 moves to x = 3/3 = 1.
The same happens to y coordinates from earlier.
Q1 goes from y = 0 to y = 0/3 = 0 (I mean, stays along y). Q2 goes from y = 0.5 to y = 0.5/3. And Q3 goes from y = 1.5 to y = 1.5/3 = 0.5.
In more jargon, there is a pattern and the final coordinates look like this.
Q1, the 1st point is at (1/3, 0).
Q2, the 2nd point is at (2/3, 0.5/3) or
$$ \left( \frac{2}{3}, \frac{1}{3}\cdot (1) \cdot \frac{1}{3 - 1} \right) $$
and Q3, the 3rd point is at (1, 0.5) or (3/3, 1.5/3) or
$$ \left( \frac{3}{3}, \frac{1}{3}\cdot (1 + 2) \cdot \frac{1}{3 - 1} \right) $$
There is a pattern here and we can say that if n was 4, (this is, we sampled 4 points and divided the main line AB into 3 segments)
For n = 4, Q1, the 1st point is at (1/4, 0).
Q2, the 2nd point is at (2/4, 0.33/4) or
$$ \left( \frac{2}{4}, \frac{1}{4}\cdot (1) \cdot \frac{1}{4 - 1} \right) $$
Q3, the 3rd point is at (3/4, 1/4) or
$$ \left( \frac{3}{4}, \frac{1}{4}\cdot (1 + 2) \cdot \frac{1}{4 - 1} \right) $$
and Q4, the 4th point (final point) is at (1, 0.5) or (4/4, 2/4) or
$$ \left( \frac{4}{4}, \frac{1}{4}\cdot (1 + 2 + 3) \cdot \frac{1}{4 - 1} \right) $$
In general for n = 4,
The kth point, Qk is at
$$ \left( \frac{k}{4}, \frac{1}{4}\cdot (1 + 2 + .. + (k - 1)) \cdot \frac{1}{4 - 1} \right) $$
And one can verify that for any n,
The kth point, Qk is at
$$ \left( \frac{k}{n}, \frac{1}{n} \cdot (1 + 2 + .. + (k - 1)) \cdot \frac{1}{n - 1} \right) $$
which can be simplified to sum of k - 1 terms to be (k - 1)k/2, hence,
$$ \left( \frac{k}{n}, \frac{1}{n} \cdot \left(\frac{(k - 1)k}{2}\right) \cdot \frac{1}{n - 1} \right) $$
So, on simplifying,
When we sample n points,
the kth point, Qk is at
$$ \left( \frac{k}{n}, \frac{1}{2} \cdot \frac{k}{n} \cdot \frac{k - 1}{n - 1} \right) $$
Now, it should make sense, why the final point is always at y = 0.5,
for the nth point,
$$ \left( \frac{n}{n}, \frac{1}{2} \cdot \frac{n}{n} \cdot \frac{n - 1}{n - 1} \right) $$
giving us,
$$ \left( 1, 0.5 \right) $$
What we care about is if when we sample large number of points (that is \( n \to \infty \) ), the points, obey the equation of the parabola.
I think, we can agree that, when \( n \to \infty \)
$$ \frac{k - 1}{n - 1} \thickapprox \frac{k}{n} $$
So, when \( n \to \infty \), the kth point is given by,
$$ \left( \frac{k}{n}, \frac{1}{2} \cdot \frac{k}{n} \cdot \frac{k}{n} \right) $$
or
$$ \left( \frac{k}{n}, \frac{1}{2} \cdot \left(\frac{k}{n}\right)^2 \right) $$
if we take x = k/n, then
$$ \left(x, \frac{1}{2} \cdot \left(x\right)^2 \right) $$
or
$$ \left(x, \frac{x^2}{4 \cdot 0.5} \right) $$
which is what we wanted. IT IS A PARABOLA! :D
And... this gives us
\( a = 0.5. \) Yay! :D
Also, since a = 0.5, the point H is always at (2a, a), so the final point is the point H at (1, 0.5).